31 Dec

CANADIAN JOBLESS RATE FELL TO A 42-YEAR LOW IN NOVEMBER

General

Posted by: Lisa Barakzai

CANADIAN JOBLESS RATE FELL TO A 42-YEAR LOW IN NOVEMBER

With so much bad news coming out about the economy, Statistics Canada this morning posted a blockbuster jobs report, mitigating worries about the health of the economy.

Employment increased by a whopping 94,100 in November, led mostly by full-time jobs that were broadly based across industries. This was the largest monthly jobs gain in records dating back to 1976. The unemployment rate fell to 5.6%, also the lowest in the data, from 5.8% in October.

The strength in employment was unexpected as economists forecast a gain of only 10,000. Just this week, the Bank of Canada painted a picture of an economy facing substantial headwinds, warning of turmoil in the oil sector, government ordered oil production cuts in Alberta and a potential U.S.-China trade war. Since Wednesday’s central bank decision to hold rates steady announced in a decidedly pessimistic press release, markets had been pricing in only one rate hike in 2019.

Some analysts pondered whether the rate-hiking cycle is already over after five increases since the middle of 2017. “My bet is the BoC is done, period,” David Rosenberg, chief economist and strategist at Gluskin Sheff + Associates Inc., told clients in a report this week.

In a speech on Thursday, Governor Poloz reiterated his view that the Bank will eventually need to bring the current 1.75% policy rate back into “neutral range” of somewhere between 2.5% and 3.5%–noting the environment of low unemployment, inflation close to target and an economy close to full capacity utilization.

The strong November labour force report certainly keeps a January rate hike on the table for now, but only if it is confirmed by strengthening incoming economic indicators and no reversal in the December jobs report.

The Canadian dollar rallied on the news–having dropped appreciably in the previous three days–and market interest rates edged upward for the first time in a week and a half. The five-year government bond yield, an important indicator of five-year fixed mortgage rates edged up three basis points, offsetting a bit of the monthly decline.

Even the oil-producing hub of Alberta showed strength, adding 23,700 jobs on the month and pushing down the unemployment rate by a full percentage point to 6.3%, near its lowest since 2015 (see chart and table below).

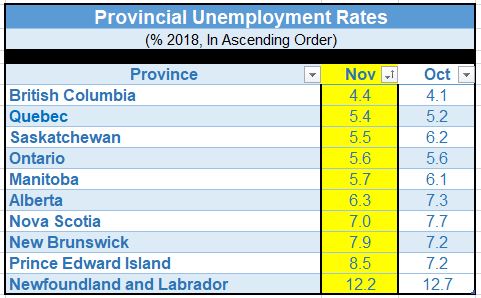
Employment rose in six provinces, led by Quebec, Ontario and Alberta, and was little changed in the four Atlantic provinces. In Ontario, employment increased by 20,000 compared with October, the result of gains in full-time work. The number of unemployed was little changed and the unemployment rate held steady at 5.6%. The number of employed people in British Columbia grew by 16,000 in November. The unemployment rate rose 0.3 percentage points to 4.4%. There were 5,500 more employed people in Saskatchewan. The unemployment rate declined by 0.7 percentage points to 5.5%, the second decrease in three months. In November, there were 2,600 more Manitobans employed. The unemployment rate fell 0.4 percentage points to 5.7%, as fewer people searched for work.

The private sector dominated the employment gains last month as more people worked in professional, scientific and technical services; health care and social assistance; construction; business, building and other support services; transportation and warehousing; and agriculture. At the same time, fewer people worked in information, culture and recreation. Employment in construction increased by 15,000, led by gains in British Columbia and tempered by a decline in Newfoundland and Labrador. Year over year, employment was little changed in the industry.

Employment increased for both core-aged women and men (aged 25 to 54), as well as for older people (aged 55 and over)—driven by men.

Jobs in the Cannabis Industry

For the first time, Stats Canada reported cannabis-related jobs. Non-medicinal cannabis became legal in Canada on October 17, 2018. The number of people employed in these jobs in November was 10,400, an increase of 7,500 (+266%) from 12 months earlier. The majority (58%) of cannabis-related employment in November was in the agriculture sector, where workers performed duties such as bud trimming. The rest of the hiring was spread across a number of other industries such as educational services, health care, and retail trade.

More men than women worked in these jobs (79% compared with 21%). The median age was 35 years, younger than the median for workers in non-cannabis-related jobs (40 years). Virtually all of the employees were working full time and had permanent positions. The highest level of cannabis-related employment was in Ontario, an estimated 5,700, representing more than half of the national total. Ontario is the province with the largest concentration of licensed producers.
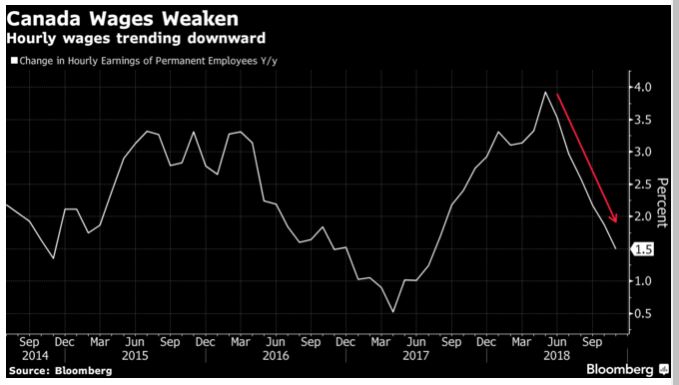
Wages Weakened

The one negative component of the November labour report was the slowdown in the growth of wages. Annual gains decelerated sharply to 1.7% in November– the slowest growth since July 2017–compared to a 2.2% clip the prior month. Wage gains for permanent workers were 1.5%, also the slowest in more than a year. This compares to 3.1% year-over-year wage growth in the U.S.

The U.S. Posted Weaker Than Expected Jobs and Wages in November

U.S. jobs and wages rose by less than forecast in November while the unemployment rate held at the lowest in almost five decades, indicating some moderation in a still-healthy labour market.

Nonfarm payrolls increased by 155,000 after a downwardly revised 237,000 gain in the prior month, a Labor Department report showed Friday. The median estimate in a Bloomberg survey called for an increase of 198,000. Average hourly earnings rose 0.2% from the prior month, compared with forecasts for 0.3%, though wages matched projections on an annual basis, up 3.1% for a second month.

Tariffs began to bite as employment gains at primary and fabricated metals manufacturers edged upward, but people who use those metals like auto and auto parts manufacturers saw job cutbacks.

Christmas hiring did not match last year’s pace as retail jobs rose by 18,000 roughly 10,000 fewer than this time last year, mostly at department stores. These gains were offset in part by job declines at furniture stores, clothing and accessories stores, electronics and appliance stores, and bookstores. This might have had something to do with online shopping uptrends as couriers and messenger jobs increased significantly.

The broader measure of unemployment known are U-6, or the underemployment rate rose to 7.6% from 7.4%. This measure includes part-time workers who want a full-time job and people who are less active in seeking work.

DR. SHERRY COOPER
Chief Economist, Dominion Lending Centres
21 Dec

CANADIAN HOME SALES WEAKENED FURTHER IN NOVEMBER

General

Posted by: Lisa Barakzai

CANADIAN HOME SALES WEAKENED FURTHER IN NOVEMBER

Statistics released today by the Canadian Real Estate Association (CREA) show that national home sales dipped for the third consecutive month, down 2.3% from October to November and down a whopping 12.6% year-over-year. Transactions declined in just over half of all local markets, with lower activity in the Greater Toronto Area (GTA), the Greater Vancouver Area (GVA) and Hamilton-Burlington offsetting increased sales in Edmonton. Sales were down from year-ago levels in three-quarters of all local markets, including the Lower Mainland of British Columbia, Calgary, the GTA and Hamilton-Burlington.

These data suggest a double-digit national sales decline in 2018, falling to its lowest level in five years even though the economy is reaching full employment. Next year’s growth in sales and prices will likely be moderated by recent policy changes from different levels of government, in addition to upward pressure on interest rates.

Many had expected a rebound in sales in British Columbia, but so far it has not materialized. The rebound in sales in Ontario last summer has now run its course and activity in Alberta has edged lower. Housing transactions in Quebec, in contrast, were strong.

New Listings

The number of newly listed homes fell by 3.3% between October and November, with new supply declining in roughly 70% of all local markets.

With new listings having declined by more than sales in November, the national sales-to-new listings ratio tightened slightly to 54.8% compared to 54.2% in October. This measure of market balance has remained close to its long-term average of 53.4% since the beginning of 2018.

Based on a comparison of the sales-to-new listings ratio with the long-term average, about 60% of all local markets were in balanced market territory in November 2018. There were 5.4 months of inventory on a national basis at the end of November 2018. While this remains in line with its long-term average of 5.3 months, the number of months of inventory is well above its long-term average in the Prairie provinces as well as in Newfoundland & Labrador. By contrast, the measure is well below its long-term average in Ontario, New Brunswick and Prince Edward Island. In other provinces, sales and inventory are more balanced.

Home Prices

The Aggregate Composite MLS® Home Price Index (MLS® HPI) was up 2.3% y/y in October 2018, down once again on a month-over-month basis.

Following a well-established pattern, condo apartment units posted the largest year-over-year price gains in November (+6%), followed by townhouse/row units (+4%). By comparison, one-storey single-family homes posted a modest increase (+0.4%) while two-storey single-family home prices held steady (+0.1%).

Trends continue to vary widely among the 17 housing markets tracked by the MLS® HPI. In British Columbia, home price gains have been steadily diminishing on a y/y basis in the Fraser Valley (+4.7%) and Victoria (+7.2%). By contrast, price gains picked up elsewhere on Vancouver Island (+12.6%) and, for the first time in five years, were down (-1.4%) from year-ago levels in the GVA. On a month-over-month basis, prices fell 1.9% in Greater Vancouver in November, the most since 2008, adding to the recent series of price declines in Canada’s most expensive housing market.

Among housing markets tracked by the index in the Greater Golden Horseshoe region, MLS® HPI benchmark home prices were up from year-ago levels in Guelph (+9.3%), the Niagara Region (+7.2%), Hamilton-Burlington (+6.3%), Oakville-Milton (+3.4%) and the GTA (+2.7%). Meanwhile, home prices in Barrie and District remain below year-ago levels (-2.1%).

Across the Prairies, benchmark home prices remained below year-ago levels in Calgary (-2.9%), Edmonton (-1.9%), Regina (-4%) and Saskatoon (-0.3%). Excess supply of listings relative to demand will continue to put downward pressure on prices until economic activity in the region strengthens.

In contrast, home prices rose 6.6% y/y in Ottawa (led by a 7.3% increase in two-storey single-family home prices), 6.2% in Greater Montreal (driven by a 9.4% increase in townhouse/row unit prices) and 4.2% in Greater Moncton (led by an 11.2% increase in townhouse/row unit prices). (Table 1)

The actual (not seasonally adjusted) national average price for homes sold in November 2018 was just over $488,000, down 2.9% from the same month last year.

Sales in Greater Vancouver and the GTA, two of Canada’s most active and expensive markets, bias upward heavily skew the national average price. Excluding these two markets from calculations cuts almost $110,000 from the national average price, trimming it to just over $378,000.

Bottom Line

We are likely in store for a prolonged period of modest housing gains in the Greater Golden Horseshoe, stability or softening in British Columbia and further weakening in the Prairies, Alberta, and Newfoundland & Labrador.

The Canadian housing market has slowed considerably since mid-2017 and is ending the year on a quiet note. Two offsetting forces are impacting housing—strong population growth and rising rates. Sluggish sales and modestly rising prices nationally are likely in store for 2019. While there will still be some significant regional divergences, there is no need for further policy actions to affect demand.

DR. SHERRY COOPER
Chief Economist, Dominion Lending Centres
7 Dec

THE #1 MISCONCEPTION ABOUT MORTGAGE FINANCING!

General

Posted by: Lisa Barakzai

THE #1 MISCONCEPTION ABOUT MORTGAGE FINANCING!

It is a reoccurring but common misconception that you will qualify for a mortgage in the future because you have qualified for a mortgage in the past.

This is not accurate!

Do. Not. Assume. Anything.

Even if your financial situation has remained the same or has improved, securing mortgage financing is more difficult now than it has in recent years.
The latest changes to mortgage qualification by the federal government has left Canadians qualifying 20-25% less. On top of that, guidelines that lenders would use in determining your suitability have been replaced with non-negotiable rules and declarations.

As mortgage professionals, we keep up to date with the latest trends going on in the mortgage world by understanding lender products and staying attentive to evolving changes.

From experience, we can tell you that having a plan is crucial to a successful mortgage application. Making assumptions about your qualification or just “winging it” is a recipe for disaster. Here are a few points on why a mortgage broker is a must for the first time home-buyer.

1. They have access to over 40 different lenders, not just one
2. They work for you, not for the lender
3. They will guide you through the application process
4. They save you valuable time by shopping for you
5. They pull your credit once — if you go to multiple banks, you will have multiple credit pulls

If you are thinking about buying a property, please feel free to contact a Dominion Lending Centers mortgage professional where we can help you devise a full-proof plan!

CHRIS CABEL