
CANADIAN HOME SALES WEAKENED IN OCTOBER
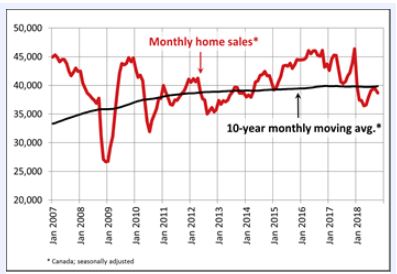
 Statistics released today by the Canadian Real Estate Association (CREA) show that national home sales declined for the second consecutive month in October, edging back by 1.6% month-over-month (m/m) and down 3.7% from year-ago levels. Year-over-year sales in October are now about in line with their 10-year monthly average (see chart below). Existing home sales activity has picked up from levels early this year, but it is still considerably below the boom days of 2016 and early-2017 before the foreign purchase tax was introduced in Ontario (in April 2017), the new OSFI rules were implemented (in January 2018), and Bank of Canada tightening gained momentum.
Home transactions last month declined in more than half of all local markets, led by Hamilton-Burlington, Montreal and Edmonton. Although activity did improve modestly in many markets, it was offset by a decline in sales elsewhere by a factor of two. On a year-over-year (y/y) basis, sales were down in slightly more than half of all local markets as lower sales in Greater Vancouver and the Fraser Valley more than offset the rise in sales in the Greater Toronto Area (GTA) and Montreal by a wide margin.
New Listings
The number of newly listed homes edged down 1.1% between September and October, led by the GTA, Calgary and Victoria. The decline in new supply among these markets more than offset an increase in new supply in Edmonton and Greater Vancouver.
As for the balance between sales and listings, the national sales-to-new listings ratio in October came in at 54.2% — close to September’s reading of 54.4% and its long-term average of 53.4%. Based on a comparison of the sales-to-new listings ratio with the long-term average, about two-thirds of all local markets were in balanced market territory in October 2018.
There were 5.3 months of unsold inventory on a national basis at the end of October 2018. While this remains in line with its long-term national average, the number of months of inventory is well above its long-term average in the Prairie provinces and in Newfoundland & Labrador, where downward pressure on home prices is likely to continue. By contrast, Ontario and Prince Edward Island are the two provinces where the measure remains more than one standard deviation below its long-term average pointing to stable prices or modest gains. In other provinces, the number of months of inventory is closer to its long-term average and suggests that sales and inventory are well balanced.
 Home Prices
The Aggregate Composite MLS® Home Price Index (MLS® HPI) was up 2.3% y/y in October 2018 with similar gains posted in each of the three previous months.
Following a well-established pattern, condo apartment units posted the largest y/y price gains in October (+7.4%), followed by townhouse/row units (+3.9%). By comparison, one-storey single-family homes posted a modest increase (+0.6%) while two-storey single-family home prices held steady.
Trends continue to vary widely among the 17 housing markets tracked by the MLS® HPI. In British Columbia, home price gains have been diminishing on a y/y basis (Greater Vancouver: +1%; Fraser Valley: +6.8%; Victoria +8.5%; elsewhere on Vancouver Island: +11.8%). Vancouver’s market balance is the weakest in almost six years, and prices for both condos and single-detached homes are now falling outright (the former were previously sturdy).
By contrast, MLS® HPI benchmark price comparisons are improving on a y/y basis among housing markets in the Greater Golden Horseshoe (GGH) region of Ontario that are tracked by the index. Home prices were up from year-ago levels in Guelph (+9.3%), Hamilton-Burlington (+6.8%), the Niagara Region (+6.3%), the GTA (+2.6%) and Oakville-Milton (+2.2%). While home prices in Barrie and District remain slightly below year-ago levels (-0.9%), declines there are shrinking; if current price momentum persists, home prices in December are on track to turn positive compared to December 2017.
Across the Prairies, benchmark home prices remained below year-ago levels in Calgary (-2.6%), Edmonton (-2.4%), Regina (-3.6%) and Saskatoon (-0.9%).
Home prices rose by 6.6% y/y in Ottawa (led by a 7.4% increase in two-storey single-family home prices), by 6.3% in Greater Montreal (driven by a 9.8% increase in townhouse/row unit prices) and by 4.2% in Greater Moncton (led by a 12.4% increase in townhouse/row unit prices) (see table below).
Bottom Line
Housing markets continue to adjust to regulatory and government tightening as well as to higher mortgage rates. The speculative frenzy has cooled, and multiple bidding situations are no longer commonplace in Toronto and surrounding areas. The housing markets in the GGH appear to have bottomed. However, prices still look soggy at the higher end of the single-family home market.
The slowdown in housing markets in the Lower Mainland of BC accelerated last month as the sector continues to reverberate from provincial actions to dampen activity, as well as the broader regulatory changes and higher interest rates.
We are likely in store for a prolonged period of modest housing gains in the Greater Golden Horseshoe, stability or softening in British Columbia and further weakening in the Prairies, Albert, and Newfoundland & Labrador.
Montreal and Ottawa remain the areas of relative strength among the biggest cities. Sales dipped in both cities month-over-month in October, but they are both up a solid 11% from a year ago. In Montreal, we’ve seen some evidence that increased foreign buying activity is mixing with strong domestic fundamentals, pushing benchmark prices up 6.3% y/y. Ottawa has been boosted by a wave a federal government spending and hiring, with price growth similarly running at 6.6% y/y, though now softening from its recent high.
The Bank of Canada is expected to continue gradually tightening monetary policy. Residential mortgage credit growth has slowed to a 17-year low and, for the first time in a decade, borrowers will be refinancing 5-year fixed rate mortgages at higher interest rates.
Bank Of Canada Reports Dramatic Drop in Highly Indebted Borrowers
In a separate report, the Bank of Canada announced this week that the quality of new mortgage lending in Canada had improved markedly owing to tighter mortgage qualification rules and higher interest rates, both of which have pushed marginal buyers out of the market. This was Ottawa’s intention all along in its multiple initiatives to dampen the housing market over the past several years.
The share of new mortgages going to highly indebted borrowers–those with loan-to-income ratios of above 450%–dropped to 13% in the second quarter of this year, down from more than 18% last year. Hence, the Bank believes that there is strengthening resiliency in the financial system, aided in part by an improving economy that has prompted five rate increases since the middle of last year.
The Bank of Canada report on the mortgage market found that not only are the number of new mortgage borrowers declining, but the riskiest ones are being weeded out. The number of new uninsured borrowers considered highly-indebted fell by 39% in the second quarter from year-ago levels, with Toronto posting the most significant declines.
The Bank also commented that the tighter regulations have had one side effect–shifting market share away from the country’s six biggest banks to other institutions such as credit unions and private lenders, which they see as a potential new source of risk. The overall riskiness of new mortgages has decreased “because the proportion of risky borrowers has declined across cities,” the report found. “As well, the regional composition has shifted, with a somewhat larger share of new mortgages recently coming from areas outside Toronto and Vancouver.”
